Monday, March 6, 2017

determinants of SRAS

Determinants of the SRAS:

Image result for sras

  • Input prices
    • Domestic resource prices
      • Wages (75%)
      • Cost of capital
      • Raw material
    • Foreign resource prices
      • Strong $ = lower price
      • Weak $ = higher price
    • Market price
      • Monopolies and cartels that control resources control the price of those resources
      • Increase in resource prices cause SRAS to go left
      • Decrease in resource prices cause SRAS to go right
  • Productivity
    • Total input/total output
    • More productivity = lower unit production cost causes SRAS to go right
    • Lower productivity = higher unit production cost causes SRAS to go left
  • Legal institutional environment
    • Taxes and subsidies
      • Taxes ($ to gov’t) on business increase per unit production cost causes SRAS to go left)
      • Subsidies ($ from gov’t) to business reduce Per unit production cost causes SRAS to go right
    • Government regulation
      • Everment regulation creates a cost of compliance. Causes SRAS to go left
      • Deregulation reduces complains cost. Causes SRAS to go right

investment demand and interest rate

Investment demand and interest-rate:


  • Image result for investment demand and interest rate
    Businesses make investment decisions by cost-benefit analysis
  • Businesses determine the benefits through expected rate of return
  • Businesses Count the cost of interest costs
  • Businesses the term in the amount of investment they undertake by comparing expected rate of return to interest cost.  If the expected return is greater than the interest cost then they invest. If the expected return is less than the interest cost them they don't invest.
  • Real interest rate: R%=1%-pi
    • R= real
    • I= nominal
    • PI= inflation
  • Nominal is the observable rate of interest
  • The real interest rate determines the cost of an investment decision
  • Downward sloping is the shape of the investment demand curve


aggregate demand curve

Aggregate demand curve

Image result for aggregate demand curve
  • AD is the demand by consumers, businesses, government, and foreign countries
  • Changes in price level cause a move along the curve. Not a shift of the curve
  • The relationship between the price level and real GDP is inverse
  • Three reasons why AD is downward sloping:
    • wealth effect- higher price is reduced purchasing power of money. This decreases the quantity of expenditures. Lower price levels increase purchasing power and increase expenditures
    • Interest rate effect – as price level increases, lenders need to charge higher interest rates to get a real return on their loans. Higher interest rates discourage consumer spending and business investment
    • Foreign trade effect – when US price levels rise foreign buyers purchase if you were US goods and Americans buy more foreign goods. Exports fall and imports rise causing real GDP demand to fall. (Xn decreases)
  • Shifts in aggregate demand
    • Change in C, I, G, Xn
    • Multiplier effect that produces a greater change in the original change in the 4 components
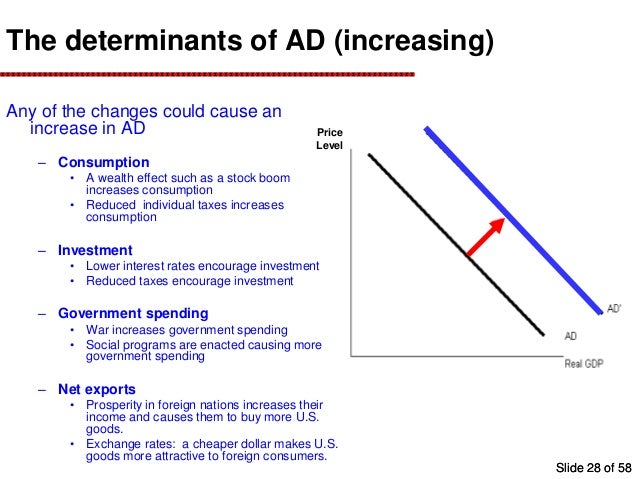
  • Increase in AD causes shift to the right
  • Decrease in AD causes shift to the left


Determinants of aggregate demand:
Image result for determinants of aggregate demand curveImage result for determinants of aggregate demand curve
  • C-(consumption)
    • Change in consumer spending. Consumer wealth(boom in the stock market). Consumer expectation(people fear a recession). Household indebtedness (more consumer debt). Taxes(decrease in income taxes)
  • Change in investment spending:
    • Real interest rates (price of borrowing money)
    • Future business expectations (high expectations)
    • Productivity and technology (new robots…)
    • Business taxes (higher corporate taxes means..)
  • Change in government spending
    • War
    • Nationalized healthcare
    • Fear causes an increase in defense spending
    • More spending- AD goes to the right
    • Less spending- AD goes to the left
  • Change in net exports
    • Exchange rates (if the U.S. dollar depreciates relative to the euro)
    • National income compared to abroad (if major importer has a recession)
    • “If US gets a cold, Canada gets pneumonia”

Sunday, February 12, 2017

ALL ABOUT UNEMPLOYMENT


  • Unemployment – percent of people in the labor force to want a job but are not working
  • Image result for Unemployment Labor force – consists of the unemployed and the employed
  • Employed – work at least one hour a month. Temporarily absent from work. Part time workers.
  • Not in the labor force – kids. Full-time students. People in mental institutions. People who are incarcerated. Retirees. Stay at home parents. Military personnel. Discouraged.
  • Unemployment rate formula: 100 X number of unemployed/total labor force
  • Standard unemployment rate equals 4-5%
  • Types of unemployment – frictional unemployment – temporarily unemployed. Qualified with transferable skills but they aren't working. Seasonal unemployment – this is a specific type of frictional unemployment which is due to time of the year and the nature of the job. These jobs will come back. Structural unemployment- changes in the structure of the labor force make some skills obsolete. Workers don't have transferable skills and these jobs will never come back. Workers must learn new skills. The permanent loss of these jobs is called "creative destruction”. Cyclical – results from economic downturn's (recessions). As demand for goods and services falls demand for labor falls and workers are fired.
  • ⅔ of unemployment are unavoidable: frictional, structural
  • Together they make the NRU(natural rate of unemployment)
  • We are at full employment if we only have 4–5% unemployment(NRU)
  • Okun’s law- . when unemployment rises 1% above natural rate, GDP falls by about 2%